Data Visualization App
|
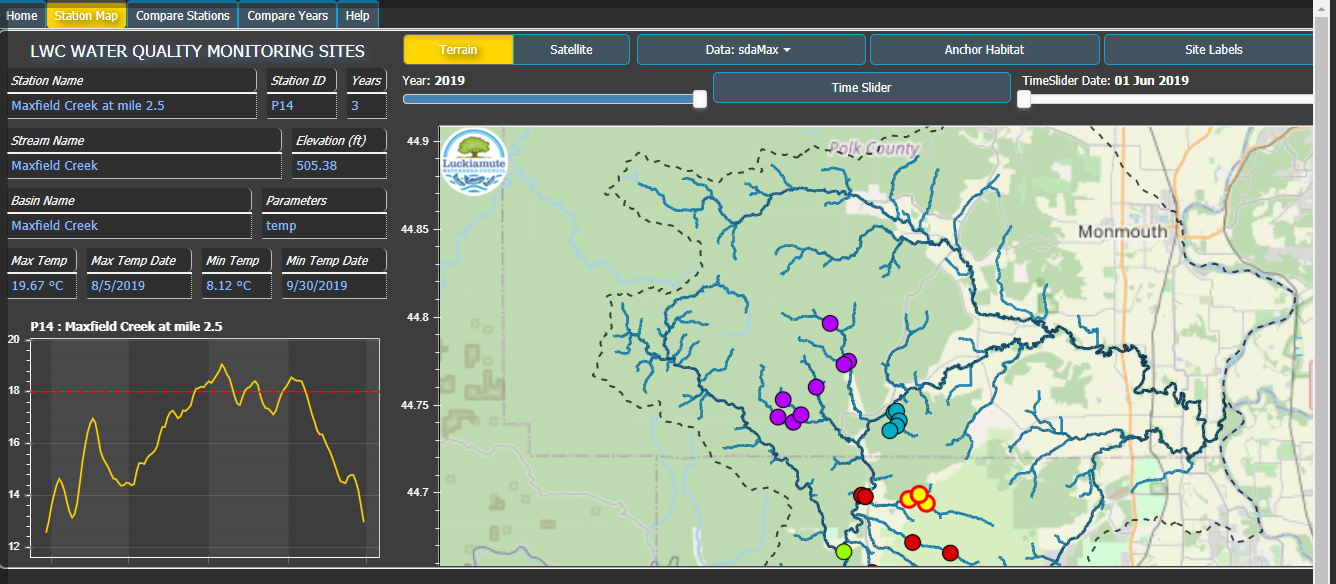
Since 2015, the Luckiamute Watershed Council has been monitoring and tracking summer water temperature data in the Luckiamute River and its tributaries. In 2020, a grant from the Oregon Watershed Enhancement Board (OWEB) allowed the LWC Monitoring Coordinator to create and launch a set of unique and interactive tools for visualizing this stream temperature data.*
This site is now up to date with the most recent temperature monitoring results, allowing you to see and explore the summer water temperature trends for several of our local rivers and streams over the past 8 years. We encourage you to experience these tools for yourself by opening your favorite web browser and navigating to https://data.luckiamute.net. |
|
*There are some monitoring sites where the landowner has granted permission to collect data but has opted to not release the data publicly. We are grateful for this access and to other funding from partners such as Hancock Forest Management to support monitoring at sites that cannot be funded by the OWEB grant. These data are not included in the public website.
|
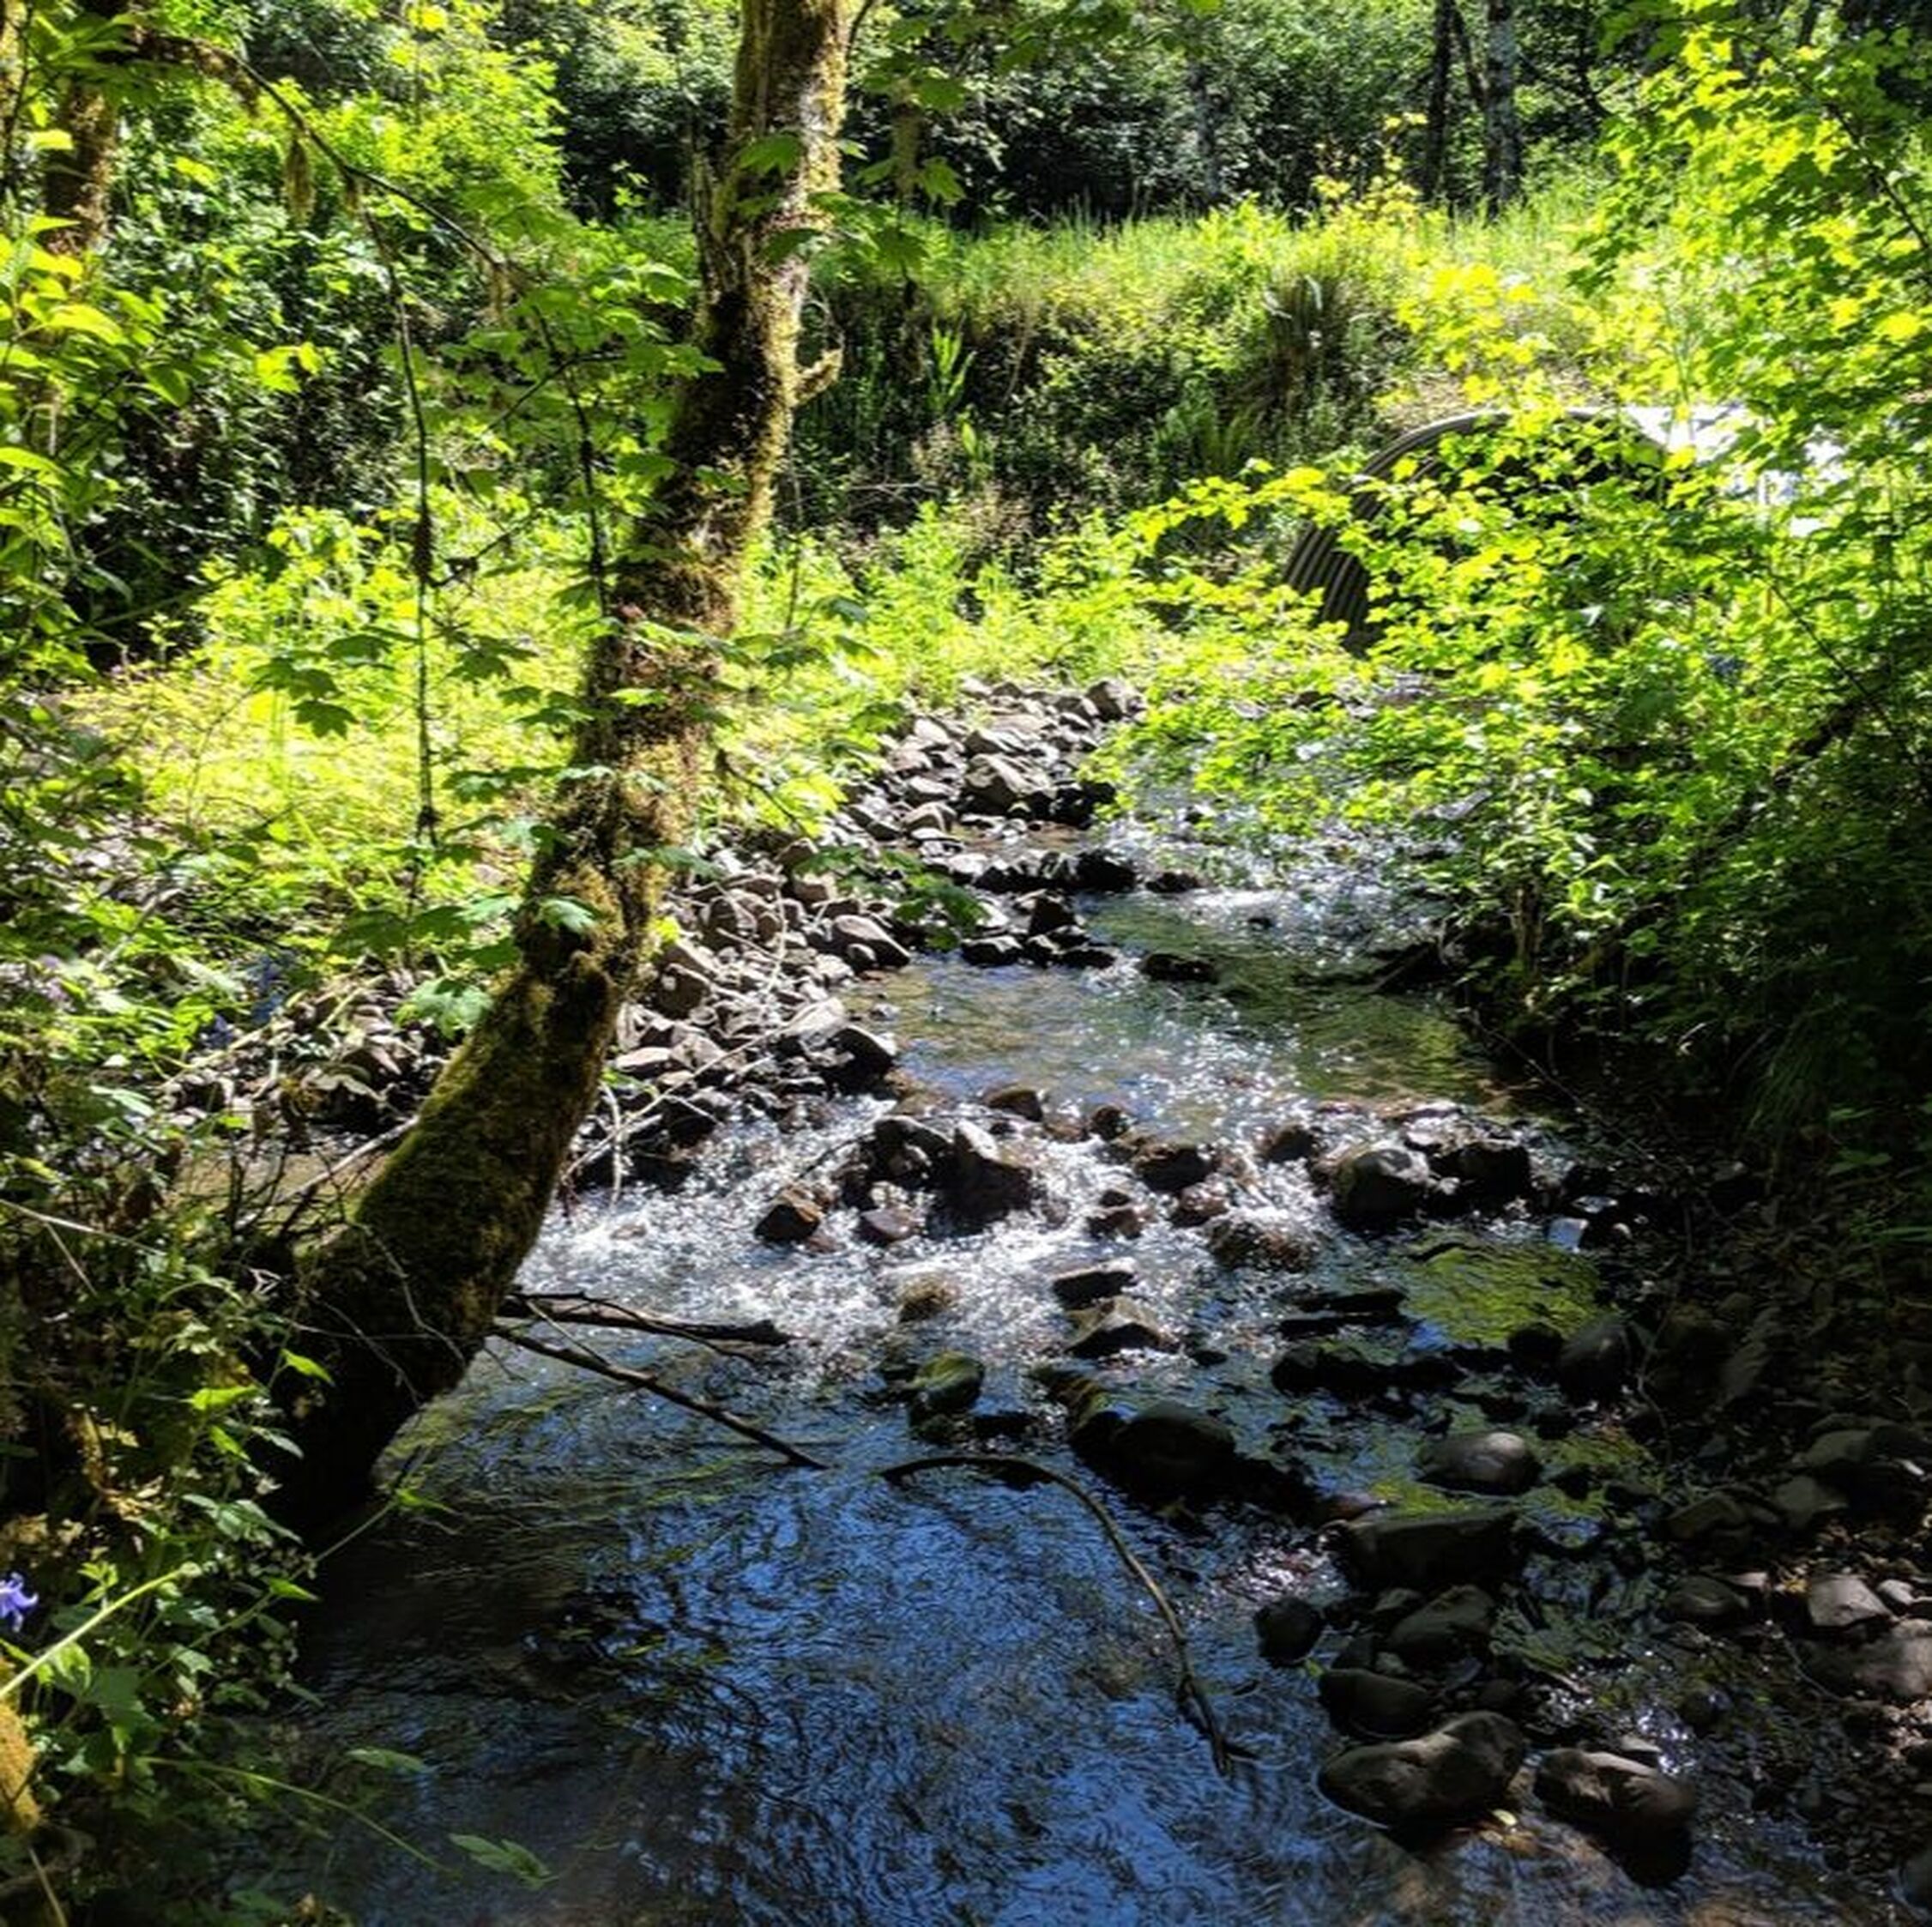
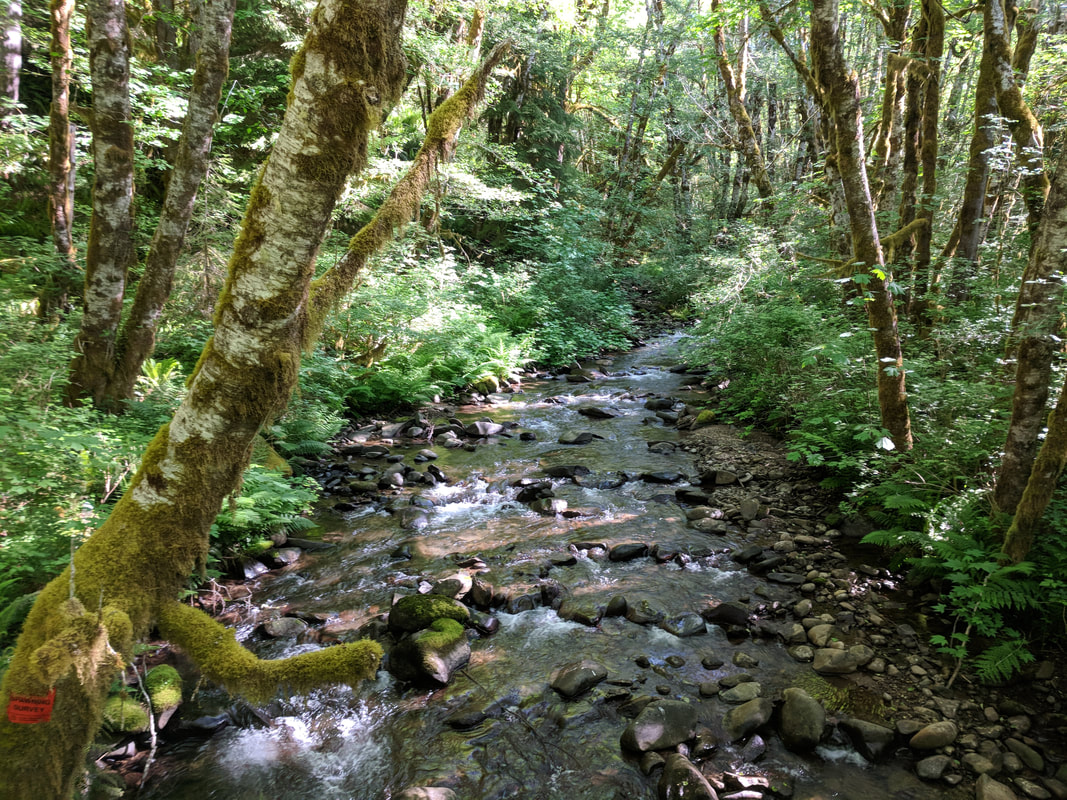
Water Quality Monitoring ProgramThe Luckiamute Watershed Council has been monitoring summer water temperatures in the Luckiamute River and its tributaries since 2015. Using temperature sensors, called ‘loggers’, which record the water temperature every hour for months at a time, we have been able to build a clearer picture of how warm the water gets during the hottest part of the year. While small streams in forested areas largely remain cool through the summer, we are seeing warming in the lower reaches of the tributaries as they approach their confluence with the Luckiamute River. By using the data generated from the Monitoring Program, the LWC can ensure that future habitat restoration projects, such as riparian revegetation and in-stream large wood placement, will be of the most benefit to native fish by providing improved habitat and cool water refuge from extreme water temperatures during the heat of the summer. In 2021, the Bureau of Land Management (BLM) awarded the LWC a grant to support our stream temperature monitoring program, and we are grateful for their valued contribution towards tracking stream health across our watershed!
Why is understanding stream temperature important?
Salmon and trout, which need cool water to survive, can thrive in the Luckiamute watershed because their life cycle is finely tuned to seasonal changes in water temperature. During the summer, when waters near the river are warmer, juvenile salmon and trout are in the cool forested areas feeding on insects and growing large enough to make the journey to the ocean. During the late winter and early spring, when steady rains keep temperatures low in larger streams and rivers, the young fish move down the system through the Luckiamute, the Willamette, and the Columbia to the sea. At about the same time, adults retrace their steps to their native streams to spawn.
Historically, the forested streambanks, gravel bars and floodplain soils that characterized small streams in the upper watershed provided cold water refuges for fish during the summer, and helped lower temperatures in the wider, slower Willamette River as well. Today, however, all of these features have been greatly reduced, and at the same time, warm water inputs from municipal and industrial discharges and run-off from buildings and paved surfaces has increased. This makes the remaining cold water refuges all the more important to find, protect and enhance. What is the monitoring program schedule like, and how can I get involved?
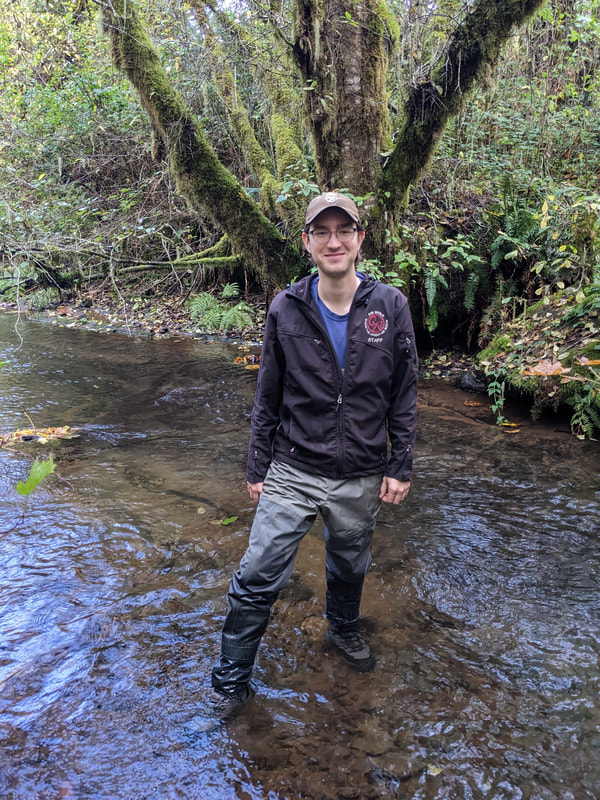
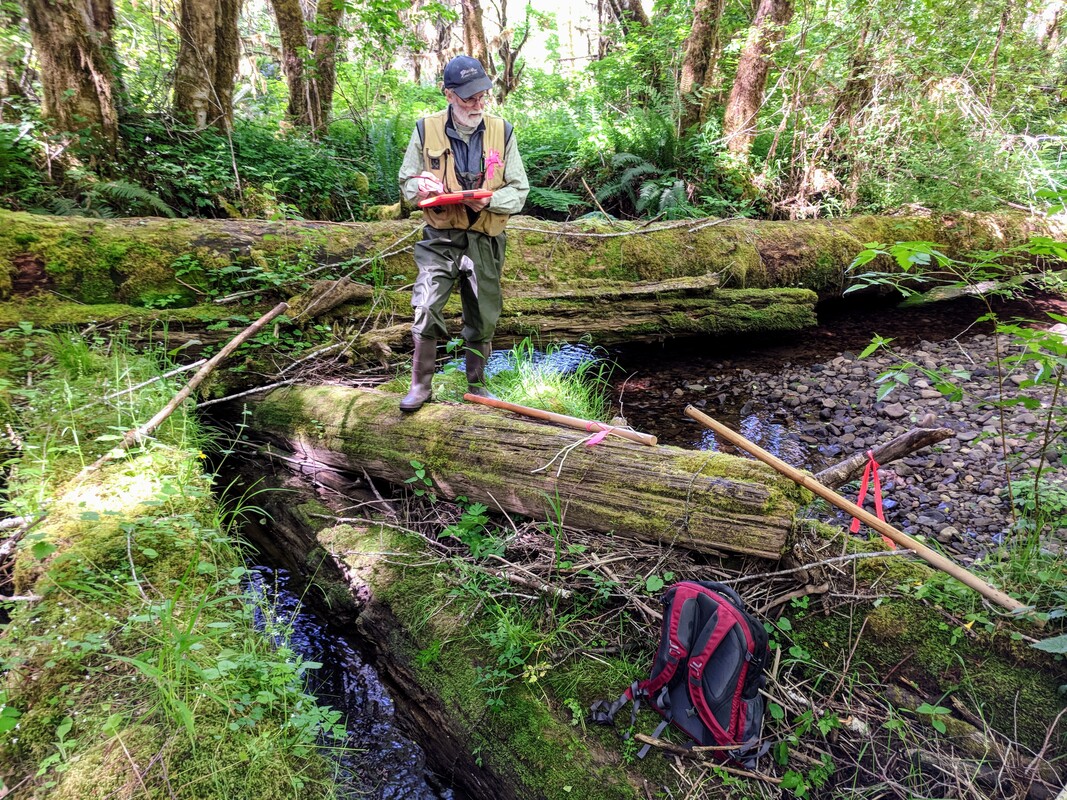
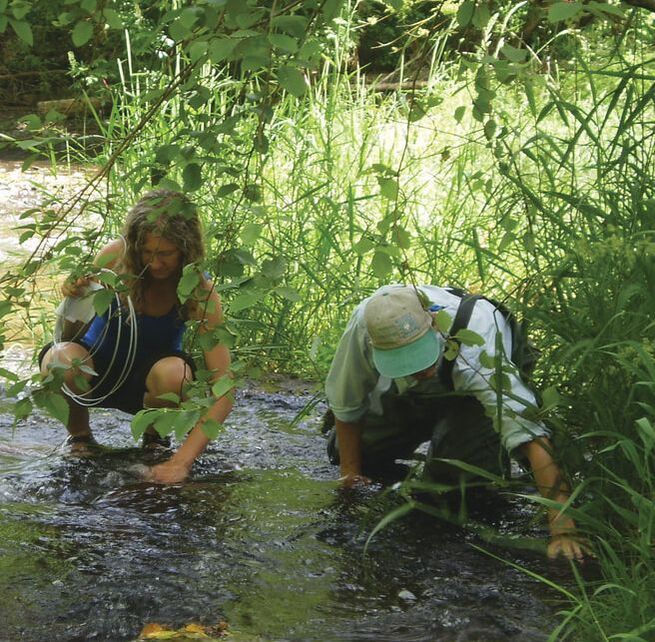
LWC staff and volunteers typically deploy the temperature loggers in May, check on their status and performance during a mid-summer site visit in July or August, and then retrieve them in October. The data is then downloaded and put through an extensive round of quality assurance and quality control checks before it is analyzed to generate useful measures of stream temperature, such as the “7-day running-average of the daily maximum”. Using these statistics, the LWC can start to paint a picture of the health of the Luckiamute watershed when water flows are low and temperatures are at their most extreme.
If you have any questions or would like to know more about the data or volunteering with the LWC’s temperature monitoring program, please feel free to contact Monitoring Program Coordinator, Jonah Nicholas, at the following email address: monitoring@luckiamutelwc.org. |
The views and conclusions contained in this document are those of the authors and should not be interpreted as representing the opinions or policies of the U.S. Government. Mention of trade names or commercial products does not constitute their endorsement by the U.S. Government.